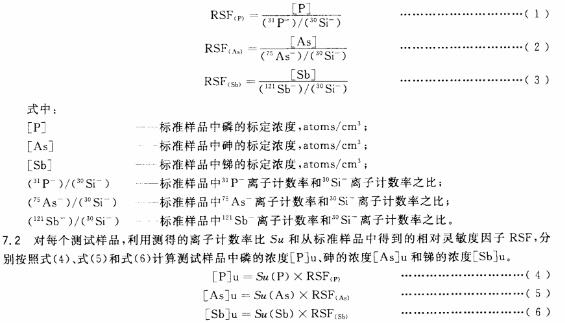
1 Scope This standard specifies the method for the determination of phosphorus, arsenic and antimony in silicon materials for photovoltaic cells using secondary ion mass spectrometry (SIMS). This standard applies to the quantitative analysis of phosphorus, arsenic and antimony in donor impurities in silicon materials for photovoltaic cells. The concentrations of phosphorus, arsenic and antimony are all greater than 1×10¹⁴ atoms/cm3. 2 method principle 3 Interference factors 3.1 Phosphorus, arsenic and antimony adsorbed on the surface of the sample can interfere with the measurement of phosphorus, arsenic and antimony in the sample. 3.2 Boron and aluminium absorbed from the sample chamber of the SIMS instrument to the sample surface interfere with the measurement of phosphorus, arsenic and antimony in the sample. 3.3 The surface of the sample in the window of the sample holder should be flat to ensure that the inclination of the surface and the ion collection optical system does not change when each sample is moved to the analysis position, otherwise the accuracy and accuracy of the measurement will be reduced. 3.4 The accuracy and precision of the measurement are significantly reduced with the increase of the surface roughness of the sample, which can be eliminated by chemical mechanical polishing of the sample surface. 3.5 Non-uniform distribution of phosphorus, arsenic and antimony in standard samples will affect the measurement accuracy. 3.6 The deviation of the nominal concentrations of phosphorus, arsenic and antimony in the standard sample will cause the deviation of the measurement results. 3.7 The detection limit may differ due to different instruments or different conditions of the same instrument. 3.8 Because secondary ion mass spectrometry is a destructive test, sampling should be performed and the sample taken should be representative of the nature of the batch of silicon material. This standard does not stipulate a uniform sampling method, because most suitable sampling plans differ depending on the sample conditions. For the purposes of arbitration, the sampling plan should be approved by the testing parties before testing. 4 Instruments and Equipment 4.1 sector magnetic field secondary ion mass spectrometer The instrument needs to be equipped with a primary ion source, an electron multiplier capable of detecting negative secondary ions, and a Faraday cup detector with a mass resolution of better than 4,000. 4.2 liquid nitrogen or liquid nitrogen cooling cryopanel If the vacuum in the analysis chamber is greater than 1.3 x 10⁻⁶Pa, apply liquid nitrogen or liquid helium cooled cryoplates around the sample holder in the analysis chamber. If the vacuum in the analysis chamber is less than 1.3×10⁻⁶ Pa, the above cooling is not required. 4.3 Test sample holder Make sure that the analysis surface of each sample on the sample holder is in the same plane and perpendicular to the extraction electric field (about several kV, depending on the instrument model). 5 sample preparation 5.1 Standard samples A silicon single crystal standard sample co-doped or separately doped with phosphorus, arsenic and antimony is required, and the body concentrations of phosphorus, arsenic and antimony are recognized by all parties. Other measurement methods were used, and the concentration was within the range of (1-10) 1016 atoms/cm3, and the distribution uniformity was within 5%. The analysis surface of the standard sample should be chemically polished or a more effective chemical mechanical polishing to make it flat and smooth. 5.2 blank samples There is a need for a silicon single crystal in a vacuum zone where the concentration of phosphorus, arsenic, and antimony is less than 5×10 13 atoms/cm 3 as a blank sample. The analysis surface of the blank sample should also be chemically polished or a better chemical mechanical polishing to make it flat and smooth. 5.3 Test samples The analysis surface of the test sample should also be subjected to chemical etching or a more effective chemical mechanical polishing to make it flat and smooth, and the sample size should fit within the sample rack. 6 Operation steps 6.1 Sample loading Place the sample in the sample rack of the secondary ion mass spectrometer (SIMS) and check to see if the sample lies flat on the back of the window and cover the window as much as possible. Samples loaded at a time include blank samples, standard samples, and test samples. 6.2 Instrument Commissioning 6.2.1 Turn on the instrument in accordance with the instrument instructions. The secondary ion mass spectrometer (SIMS) should be in good condition (eg baked) to minimize the instrument background. 6.2.2 According to the conditions described in 4.2, if it is necessary to use a cooling device, install liquid nitrogen or liquid helium into the cold trap. 6.3 Analysis Conditions 6.4 sample analysis 6.4.1 Move the sample holder so that the sputtering pit on the sample is formed near the center of the window. 6.4.2 Center the beam and begin SIMS analysis. First, the samples were sputtered for 50 to 100 magnetic field cycles with the first scanning condition until the phosphor or arsenic, antimony signal intensity was stabilized to remove residual surface contamination typically present in the natural oxide layer on the wafer surface. Then the scan area is reduced to the second scan condition and the sample is sputtered until the phosphorous or arsenic, tellurium signal is stable. 7 result calculation 7.1 Calculate the relative sensitivity factors for phosphorus, arsenic, and antimony according to equations (1), (2), and (3): 8 precision In the same laboratory, the same instrument was used by the same operator and the phosphorus, arsenic, and bismuth contents of 10 samples taken from the same wafer were tested according to this method. The average phosphorus concentration measured was 1.5×10¹⁴ atoms/cm3, the standard deviation was 1.4×10¹³ atoms/cm3, the relative standard deviation was 9.3%, the average arsenic concentration was 1.0×10¹⁴ atoms/cm3, and the standard deviation was The relative standard deviation was 7.8% at 7.8×10¹³ atoms/cm3, 1.2×10¹⁴ atoms/cm3 at the mean value, and the standard deviation was 1.2×10¹³ atoms/cm3 with a relative standard deviation of 10.0%. 9 Report At a minimum, the report should include the following: a) Sample delivery unit and sample delivery date; b) sample name, specification and number; c) sample status description; d) sampling position; e) standard sample and blank sample information; f) the instrument model; g) measurement environment; h) measurement results, including relative sensitivity factors and impurity concentrations; i) Operator, measurement date, measurement unit. Hydrogen Peroxide,Carbamide Peroxide,Hydrogen Dioxide,Sodium Peroxide Jiang Xi Hi-Tech Technology Co.,Ltd. , https://www.hi-techmasterbatch.com